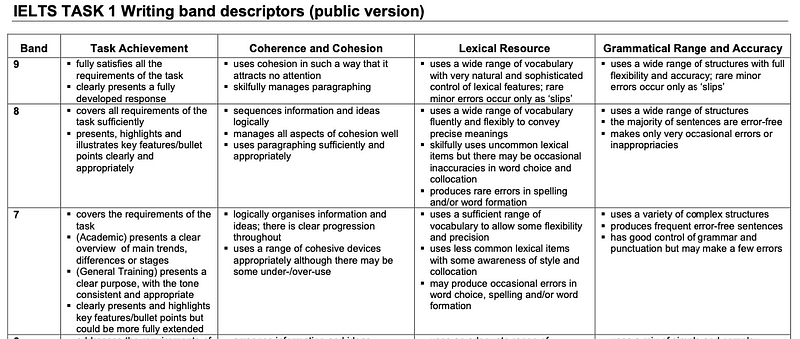
Task 1佔分 33.3%,建議分4段,寫150–200 字,用不多於15–20 min。計分方面,Task Achievement(內容)、Coherence & Cohesion(組織)、Grammar(文法)、Vocab(詞彙)四項各佔25%。可見,由於IELTS是語文試,最重要的不是what you are going to say,it’s more about how you say it。
Source: British Council
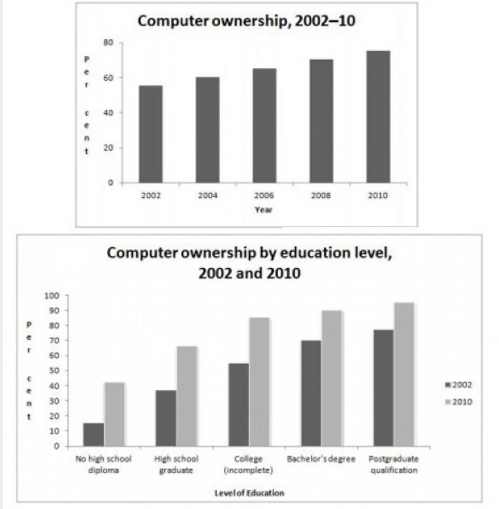
Academic考圖表分析(e.g. bar chart、pie chart、line graph、table、map和diagram等)。
General Training則考書信寫作(e.g. 投訴信、申請信、推薦信、予以建議/指示/要求的信)。
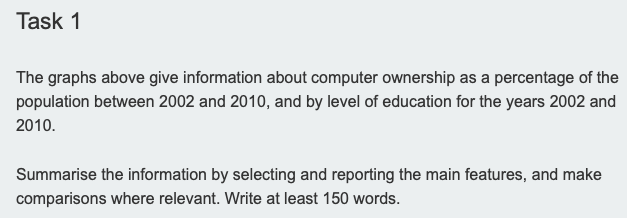
以下是一道Academic Writing Task 1的題目:
Source: British CouncilSource: British Council
面對Academic Writing Task 1小作文的圖表分析題目,迅狐建議用4段式寫作:Intro + Overview + Point 1 + Point 2 (不用Conclusion,因為與Overview重疊)
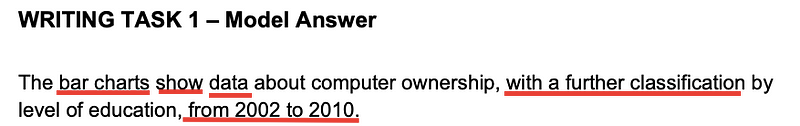
紅色的部分都做了paraphrasing。例如,題目的graphs改成bar charts,between X and Y改成 from X to Y。要再改寫的話,還有很多方法,例如:
The given bar charts illustrate data on the proportion of peopleowing a computeras well as the relationship between computer ownership and education level from 2002 to 2010.
2. Overview概況 (2–3句)
常用句式:Overall,/In general, it can be seen/observed that XXX 或 XXX can be seen in
內容:上面的官方marking scheme,列明Task Achievement要取7分以上,必須給出“clear overview of main trends”。因此,這一段就是特地回應這個訴求。
如要說數字只說大概(e.g. over half,only one third, three out of four),不用徵引確切數據(尤其是幾多%),確切數據應留給第3–4段。
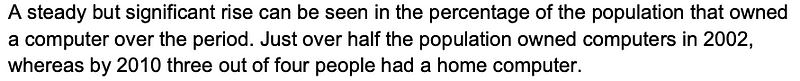
以下官方的model answer,正是用了上述的「最主要趨勢」(a steady but significant rise over the period)和「最普遍現象」(over half in 2002, three out of four by 2020)。
Source: British Council
3. 內文段落1、2 (每段3–4句)
內容:每個段落寫1–2個重要發現。可以description形容圖表(最普遍現象、最多、最少、最高、最低),或者compare and contrast比較兩者(A和B最大的相同/不同/相似,最明顯升跌幅度(大升、大跌、不變))。盡量給予準確的數據(幾多%,或增長了幾多percentage points)(注意:有些學生看到上年20%,今年30%,就算成「增加10%」,是錯的!應該是增加了10個percentage points。)
我們來拆解一下以下的官方model answer用了什麼招式:
內文段落1:
An analysis of the data by level of education shows that higher levels of education correspond to higher levels of computer ownership in both of those years.
← A和B最大的相同
In 2002, only around 15% of those who did not finish high school had a computer but this figure had trebled by 2010.
← 形容圖表(最低),以及最明顯升幅:由約15%急增至原本三倍(約45%)(注意:三倍化/增長兩倍都是對的,但有些學生說成「增長三倍」則是錯的。由1增至3的話,3是原本的300%。但在計算變幅時,新減舊除以舊,即是(3–1)/1 x 100%= 200%,即增長了200%)。
內文段落2:
There were also considerable increases, of approximately 30 percentage points, for those with a high school diploma or an unfinished college education (reaching 65% and 85% respectively in 2010).
← 明顯升幅的另外兩項數據。與overview部分不同的是,盡量引用實質數據。
However, graduates and postgraduates proved to have the greatest level of ownership in 2010, at 90% and 95% respectively, 20 percentage points higher than in 2002.


Comments
Post a Comment